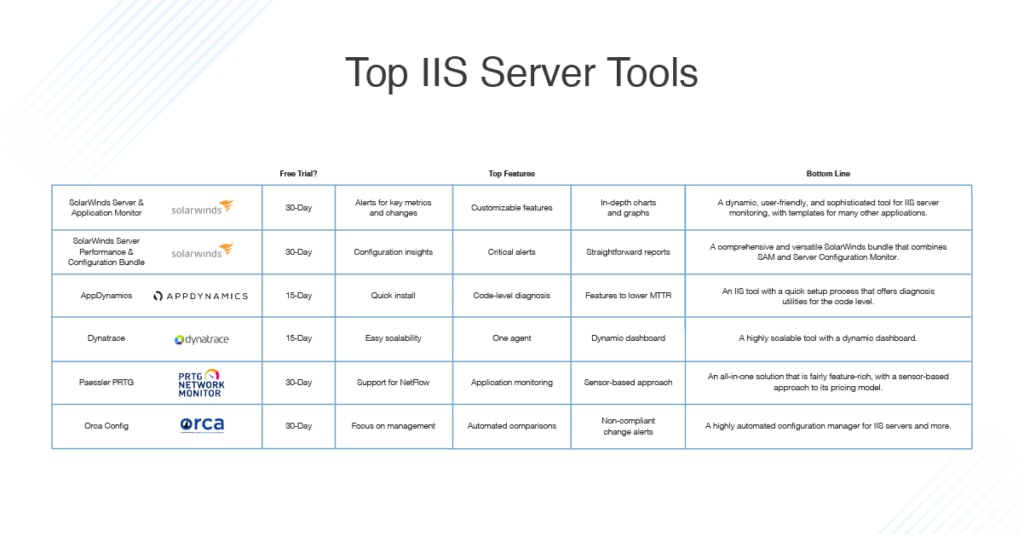
IIS, or Internet Information Services, is a multifaceted and layered subject. I’ve put together this guide to help those of you who are new to IIS understand what it does, how it does it, and how you can make it work for you. I have also provided a list of tools for IIS management.
By the end of this IIS tutorial, you should have a better understanding of IIS, along with enough information about the benefits of and how to use IIS server monitoring tools like SolarWinds ® Server & Application Monitor to improve IIS server performance.
There’s lots of technical lingo surrounding IIS. You’ll likely see the phrases “IIS web server,” “IIS server,” and “online IIS server” in your search for the right tool. To understand how IIS is spoken about, you’ll first need to understand the basics of how it works.
IIS is a web server specific to the Microsoft .NET platform. As such, it is also referred to as Windows Web Server. Though it can be run on Linux and Mac OS with a utility called Mono, I wouldn’t recommend it, because it won’t be as stable or reliable as you’d like. As IIS is designed for Microsoft .NET, a Windows IIS implementation is more dependable by far.
So, what does IIS do? As a web server, it’s the processor behind hosting web applications. You could think of it as a middleman, responsible for processing the application messages from default TCP ports. For example, 443 is the default port for HTTPS traffic, while 80 is the default port for HTTP traffic.
The traffic going into the IIS web server is sometimes referred to as a web request. According to the default settings, traffic will come in through ports 443 and 80, as explained above. This inbound traffic, or web request, can then be processed by the IIS web server in a few ways.
A typical web server can use two main processing models. In basic terms, it can either process the requests according to a single-thread model, or it can create a new thread for each individual request. The thread-per-request system is the model used by IIS, essentially accessing a thread pool and grabbing a new thread for every request.
Requests are usually processed on a simple request-response basis. The client sends a request, and a response is sent. Commonly, the internet communication between client and web server is executed by the HTTP protocol.
IIS uses its own process engine and a processing architecture with two layers, or modes: kernel mode and user mode.
The purpose of kernel mode is to use HTTP.SYS to accept incoming client requests, so it can then forward them to the application pool. This process is initiated when the client, or end user, inputs the website URL. This is essentially the client asking for page access. HTTP.SYS receives this request.
Once the application pool receives the request from HTTP.SYS, the ISAPI filter is loaded by the IIS worker process, or w3wp.exe. The worker process will open HttpRuntime.ProcessRequest and sometimes aspnet_isapi.dll as well, if it is an ASPX page. HttpRuntime creates a collection of HttpApplication objects. These are forwarded through HTTP, with HTTP modules being continuously stimulated until the ASP.NET page HTTP handler has the request. The page starts and is loaded when the request has completed the HTTP route.
There are several versions of IIS available, but those predating IIS 6 aren’t suitable for business use, so I’ll only talk about the versions that came after it.
IIS server is very popular, and its use is widespread. It offers a range of useful features and is an effective tool for many IT administrators. Typically, IIS is used for hosting ASP.NET status websites and web applications, though it’s also available for use as an FTP server and for hosting WCF services, and can host on other platforms (like PHP) when extended.
Below are the key features of IIS:
Overall, IIS is a versatile and highly configurable web server. It can do far more than host ASP.NET applications, if you extend it. By extending it, you can create a stable, flexible, and effective Windows IIS server.
Whether you install IIS on Windows 7, 8, or 10, the setup process is the same. Because IIS is a Windows feature, there isn’t much installation involved with setting it up. It’s really a matter of enabling it.
In Windows 10, you simply need to access the control panel, where you’ll have the option of turning Windows features on and off. Alternatively, you can click the Windows key at any time and type “Turn win”; this will give you a “best match” result, with a link to “Turn Windows features on or off.” This is a quick way of getting where you need to go from the home screen, without having to navigate through the control panel.
After clicking the “Turn Windows features on or off” link, you’ll open the “Windows Features” dialog box, which gives you the opportunity to turn additional Windows features on or off. This includes PowerShell 2.0, legacy components, media features, and much more. From here, you’ll also be able to turn on and off certain IIS features, like the FTP server, web management tools, and World Wide Web services. You can click the plus sign beside each feature to expand it, drilling deeper to access application development features, for example. This is where you can enable the WebSocket Protocol, CGI, and ASP.NET.
If you want to enable the Windows IIS server, use Server Manager or PowerShell to install Web Role (IIS). Decide which IIS utilities you’d like to install and press “OK” to start the installation. This might take a few minutes, but when it’s done you can get started right away. Access the IIS GUI by running the “inetmgr” command. To do it quickly from the home screen, just type “IIS” into the Windows search bar.
This is a simple setup process, and you can do it all from within your basic Windows 10 environment. Once you’ve finished setting up IIS, you’ll need to configure it. To do this, take the following steps:
Most servers will use port 80 to manage HTTP traffic, but you can change this if you think another port might be more suitable to your needs. Changing the port through which your HTTP traffic goes is easy. Open IIS Manager, right-click on your website, then click “Properties.” The properties dialog box will have a TCP port field. Change this to the port of your choice. However, remember when you alter the port number, you’ll have to enter your new port number alongside the domain name. For instance, for “domain name:80” you would replace “80” with the new port number.
If you want to do this on Windows 8 or Windows 8.1, the process is a little different. First, you’ll have to access IIS Manager, and select “Default Web Site” from the left side. Then click “Bindings” on the right side, highlight “HTTP,” and click “Edit.” You can now enter your new port into the “Port” field. Once this is complete, press “OK” and close the box, returning to the left side of the screen to choose the appropriate server node. Click “Restart Server” and you’re good to go.
Understanding how to access and take advantage of log files is an important part of maintaining an IIS server. Log files are useful because they keep track of all the activities in your server. By loading log files, you gain visibility into whatever actions you specify. You can filter the log files by time and date, the amount of transmitted data, or the related IP address.
Typically, accessing your log files is straightforward. Go to your control panel, then to “Administrative Tools.” From here, you’ll want to run IIS. You should then see your website on the left side. Select it and click on the logging icon. A dialog box will open, called “Directory.” Select “Browse” to start looking through your log files.
If you’re using IIS 6, then the process is a little different. The first part remains the same, up until you run IIS. At this stage, right-click on your website and select “Properties.” Locate the “Website” tab, then the “Active Log Format” field. Click “Properties” and the log file directory should display at the bottom of the dialog box.
IIS is mostly used for creating websites and applications, but you can also use it to create virtual directories. In IIS, specific names—chosen by you—are mapped to directories. The name gives users a quick way of accessing server-hosted content, whether in the form of another website, or via media like videos and pictures.
With IIS 6, apps and virtual directories were treated as distinct and separate components. An application was made up of metabase objects: AppRoot, AppIsolated, AppFriendlyName, and AppPoolID. From IIS 7 onward, apps and virtual directories exist in a hierarchy, which means a single site can contain numerous apps and multiple virtual directories.
Any business hoping to survive should always be considering how its security measures fare against the countless threats out there. One of these threats is unauthorized access. You can use the Secure Sockets Layer (SSL) to protect your data against unauthorized access by encrypting data. This keeps external parties and entities from gaining inappropriate access to your information, as they would need permission to do so.
Before you can use SSL to maximize your security, you’ll have to get server certification installed on your server hardware. This begins with creating a certificate. To do this, make sure Windows Server 2003 is installed, then install and configure IIS according to the instructions in this guide. You’ll also need to install Microsoft Certificate Services, which enables the creation of certificates for authentication.
Once you’ve done this, go to Internet Explorer, then Microsoft Certificate Services via http://MyCA/certsrv. Click “Request a Certificate,” then “Next.”
Click “Advanced Request,” then “Next” again, and you’ll be able to submit a request for a certificate via a form. Once you’ve done this, click “Next” and the domain name should be added.
Now, under “Intended Purpose” or “Type of Certificate Needed,” select “Server Authentication Certificate” and choose one of the following (take care NOT to select Microsoft Strong Cryptographic Provider):
Then select “Use Local Machine” and ensure the “Enable Strong Private Key Protection” box is NOT checked.
Once you’ve clicked “Submit,” your certificate will be installed instantly. If this doesn’t happen, you’ll need to wait for the certification authority administrator to administer it.
You can also attribute a certificate to a website. Do this by opening IIS Manager and clicking on “Local Computer,” then the folder titled “Web Sites.” Pick the site you want to apply the certificate to, right-click “Properties,” and click “Directory Security.”
Under “Secure Communications” you should see “Server Certificate.” Click this and open the Web Server Certificate Wizard, then select “Assign an existing certificate.”
Finish the Certificate Wizard process and go to the Properties page. Click “Directory Security.” From here you’ll be able to view the certificate.
Let’s take a closer look at application pools, as they’re such a key part of IIS. I’ll start by explaining how to create an application pool.
Go to the “Actions” field on the right side of IIS Manager and click “Add application pool.” A dialog box should pop up. Alternatively, right-click “Application Pools” in the Connections pane, for a quicker way of getting to the “Add application pool” dialog.
From here you can define the name, the .NET version, the managed pipeline mode, and whether you want the application pool to start instantly or not.
Understanding the part application pool users have to play is important. IIS will create a virtual user for each application pool. By default, worker processes run as the application pool’s virtual user, though they can also run as another specific user—e.g., a domain account—if necessary. Virtual users have folders associated with them. These are typically standard folders, like “Desktop,” “Music,” “Pictures,” “Public,” etc. Remember if you delete an application pool, the user folders will still exist. To save a little space, you can go ahead and delete these.
Every 29 hours, application pools recycle. They also recycle whenever the configuration file changes. However, you can tweak how often the application pools recycle to suit your preferences. The recycling process frees up memory being consumed by apps running in the pool and is a great way of keeping runaway processes from eating up your server memory.
But what uses up memory? Anything on the stack and heap, basically. This means static variables, static properties, items in the memory cache, object-to-object referencing, chunks of memory waiting to be disposed of, and much more. If you want to change how and when the recycling process is executed, go to “Edit Application Pool Recycling Settings.”
From here, you can tick or untick “Regular time intervals (in minutes)” and “Fixed number of requests.” When ticked, a field will open beneath the tick box, letting you enter the number of your choice. You can also define specific times by ticking the box and entering an hour into the field—for example, 8 p.m. or 6 a.m.
The recycling settings also let you determine memory-based maximums, like virtual memory usage and private memory usage.
In addition, you can alter settings for how recycling events are logged. Event log entries are generated when an application pool is recycled, according to your specifications. You can define which events call for a log to be generated. Under “Configurable Recycling Events,” you can tick or untick the following boxes:
Beneath this, you’ll see “Runtime Recycling Events.” You can tick or untick the following:
If you access the advanced settings, then you can do plenty more. For example, whenever the recycling process is initiated, a new process starts. This new process will have a new PID, but you can change this via the advanced settings if you like. You can alter pretty much any of the recycling configurations from this dialog box.
For those of you who host websites, you’re likely using either Apache or IIS. These two web servers see the most widespread use compared to any of their competitors, and there’s a lot of contention regarding which one is best. I’m not going to try to resolve that argument, but I think it’s important to understand the differences between IIS and Apache, no matter which one you choose. Perhaps you have exclusively used Apache in the past and are looking for a change. Maybe you’re torn between the two and want an impartial perspective on their benefits.
It’s difficult to choose between IIS and Apache, partly because both web servers have attracted not only a fan base, but also a group of avid haters. Moreover, what seems like an argument of IIS vs. Apache often tips into the common Microsoft vs. Linux debate. There are a lot of mixed messages out there, so hopefully this guide will afford you a more objective view.
Let’s start with Apache, otherwise known as the Apache HTTP Server. This is an open-source server created by the Apache Software Foundation. As with many open source applications, it’s freely distributed and can be edited by users. These ongoing user contributions mean the application is constantly evolving, which is one of the reasons it’s so popular. Bugs are resolved within the community, often in a highly collaborative fashion, and updates are frequent.
A big benefit of Apache is that you can run it on any major operating system. It’s most often used with Linux and combined with PHP script language and the MySQL database to create what’s commonly known as LAMP. This is a comprehensive web server solution.
Apache usage takes up a substantial chunk of the web server solution market, though its prevalence has been in decline since IIS has increased in popularity. Apache is a very versatile tool. It supports common language interfaces, including PHP, Tcl, Perl, and Python. It also has a range of authentication modules, including:
It also includes the following:
Despite its impressive suite of features, there are some issues with Apache. The main one is feature bloat. Many applications fall victim to this fault, which basically means they have a huge quantity of features that go mostly unused. An estimated 9 out of ten Apache users only use 10% of Apache utilities on a regular basis. This is quite a shocking figure, especially considering there are often complaints of Apache not being an especially speedy application. Some might deduce Apache has missed the mark in this respect, by valuing quantity over quality.
IIS, sometimes known as Microsoft IIS Server, is only available on the Windows operating system. It is, however, free to use, which is a big benefit. The only real drawback of IIS is it’s a closed Microsoft product, but that’s not necessarily a bad thing. With Microsoft behind it, there’s tons of support and resources backing IIS.
Since 2010, Microsoft IIS has seen some massive improvements, which have led to its market share steadily increasing, from 21% in 2010 to 32% in 2014. That’s a growth of 11% in just four years. This, I think, is proof of its dependability. This is an application with an increasing market share, while Apache’s market share—though substantial—is decreasing. In the same period, Apache saw a 17% drop in market share.
Between 2010 and 2014, Microsoft made some notable improvements to IIS security, making the Code Red worm vulnerability associated with IIS 6 a thing of the past.
Like Apache, IIS uses external web extensions to execute certain utilities. These include:
These features were implemented, via extensions, in version 7.5 of IIS.
Another reason IIS is so popular is it boasts ample support for Microsoft products, like the .NET framework and ASPX scripting. For those of you whose sites depend on .NET or ASPX, IIS is likely to be the preferred choice.
IIS also has impressive diagnostic utilities, covering request tracing failures, monitoring of requests, runtime data, and support for virtual hosting.
For me, IIS is the clear winner. Yes, it ties you into Windows, but I don’t see this as a problem. This is because, although IIS offers less flexibility in terms of operating system, it comes with the significant benefit of Windows-backed support and resources.
Hopefully, this guide has given you a better understanding of IIS server, how it is used, where it sits in the market, and the basics of its components. Even so, choosing among the vast range of tools available for use with IIS can be a daunting prospect. To help you along, I’ve listed my favorite IIS-compatible products below, with a review of their major advantages and pitfalls.

In ranking these products, I considered key qualities including user-friendliness, the scope of the features, the sophistication of the features, and the simplicity of the setup process. I’ve also taken into consideration user needs are likely to vary, and some tools might be better suited to specific businesses than others. Overall, SolarWinds Server & Application Monitor came out on top. This versatile, user-friendly tool is rich in features and intuitive in its design.
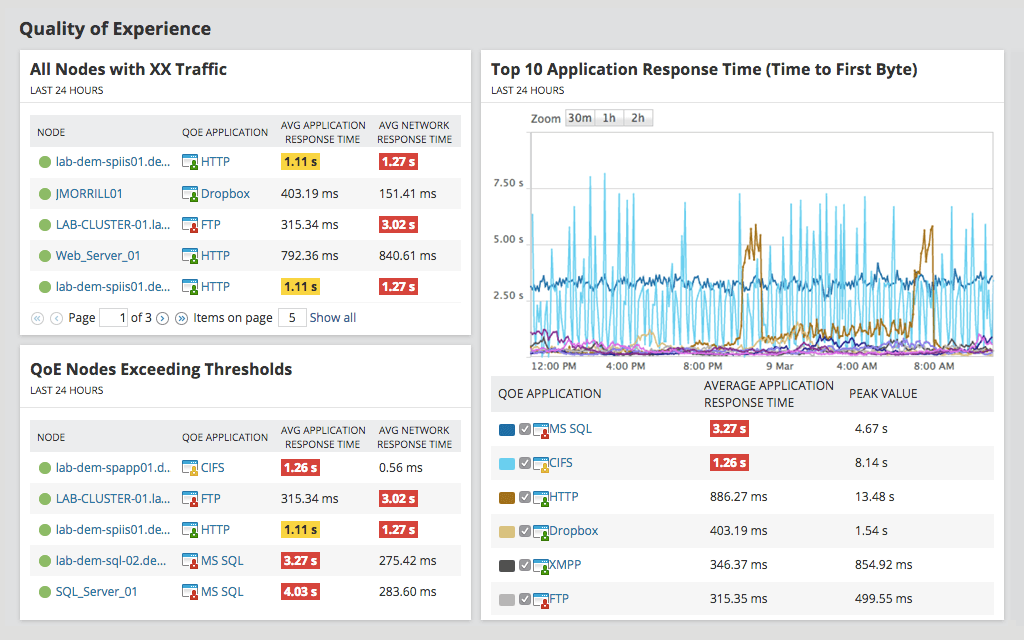
SolarWinds is a big name in the software development industry, with products covering network, systems, database, application, and IT service management. Its solutions are sophisticated but intuitively designed, with a focus on the user experience and how its products fit into wider IT activities and systems. SolarWinds Server & Application Monitor (SAM) is an application monitoring tool suitable for monitoring IIS sites.
By combining monitoring and management utilities, SAM offers a comprehensive solution for IIS server and application monitoring. You will gain visibility into IIS web server sites, their availability, and a range of other important metrics—this includes memory usage, response time, CPU usage, and disk usage. You’ll also get access to over 1,200 monitoring templates, compatible with public, private, and hybrid cloud systems. Systems and applications monitored on an out-of-the-box basis include application server alternatives, like Apache Tomcat, GlassFish, IBM WebSphere, JBoss, and Oracle WebLogic.
You can also monitor authentication servers (e.g., Microsoft Network Policy Server, RADIUS, TACACS+) and cloud infrastructure-as-a-service (e.g., Amazon AWS, Microsoft Azure IaaS). You can monitor database servers (e.g., Progress OpenEdge, SAP ASE, UniData, Oracle RAC, Apache Cassandra), IT management systems (e.g., Cisco CallManager, Microsoft System Center Configuration Manager), and much more. This list, which is far from exhaustive, demonstrates how versatile SolarWinds SAM is as a server monitoring software. If you want a monitor that can tackle IIS but offers flexibility, then SAM is an excellent option.
The user experience itself is a notable benefit of SolarWinds SAM. The console is dynamic and easy to use, and you’ll need minimal training to get started. With this tool, you’ll be able to view data in the form of colorful graphs. This approach to representing data gives you insights at a glance, saving you time and effort.
The design is another thing I like about SAM. It resembles a basic digital folder, in effect letting you scroll through subfolders. In the Application Summary window, you can group applications according to preference—for example, by application template and node name. By clicking on the arrow icon next to each name (e.g., Apache, Microsoft 365), you can open the subfolders, drilling deeper into the application without overwhelming the console with information.
If security is high on your list of priorities when looking at IIS administration tools, SAM is a good option, because it can monitor the expiration of SSL certificates. It counts down toward these dates so you’re never caught unaware, letting you easily manage SSL certificates for numerous servers and sites simultaneously.
Overall, SAM is a flexible, user-friendly solution with everything you need to successfully manage IIS resources. I highly recommend taking advantage of the 30-day free trial.
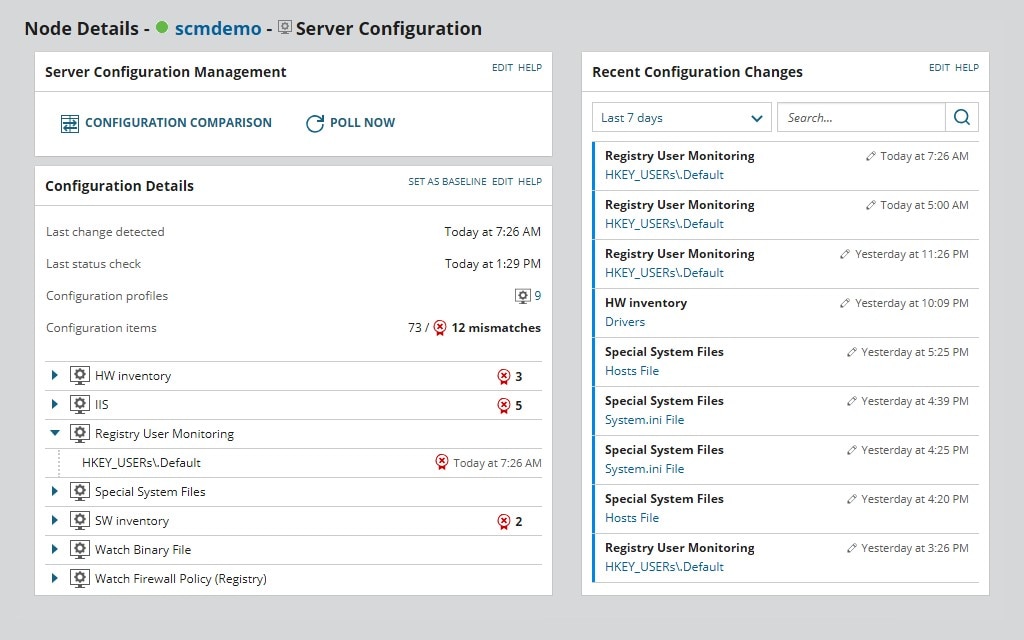
This is another great product from the team at SolarWinds. It combines the power and utility of a range of tools to provide you with a fully comprehensive server performance and configuration solution. Server Performance & Configuration Bundle (SPCB) monitors performance, health, and capacity. It’s compatible with Windows and Linux applications and can be used for remote offices, in the cloud, and in data centers. The bundle gains its competitive edge by being so flexible and by covering such a wide range of utilities.
With SPCB, discovery of applications and infrastructure is automated, making setup quick and easy. Discovered equipment is then mapped out, giving you a clear visual representation of how all your IT components are interacting, along with their status. These application maps are regularly updated, to ensure the information is always fresh and actionable. You can even use this tool to create a geographic map of your environment, giving you a granular location or site-based view.
Maps show the relationship between server infrastructure and applications, while graphs and pie charts afford you instant insight into certain metrics. This is a colorful and engaging way of representing data, without compromising on clarity. Endless chunks of text can feel overwhelming and make interpreting data time-consuming, but this graphical approach to the user console resolves that issue.
These auto-discovery and mapping utilities are included in SolarWinds SAM, reviewed above. SPCB combines SAM with SolarWinds Server Configuration Monitor (SCM). SCM brings a range of features to the table, including the ability to detect, alert, and report on any changes within the following system components:
Its specific consideration for changes to IIS configuration files is one of the many reasons this tool is so well-suited for use with Windows Web Server. You can also identify and track which changes were made by whom, so there’s always accountability and a clear audit trail.
A useful functionality offered by SCM, as part of SPCB, is you can establish a baseline for comparing current configurations. You can specify two points in time and compare those as well, so not a single change is unaccounted for. Because SCM is an agent-based monitoring system, you can track configuration changes even when servers are offline. So, once your server is back online, you’ll be instantly alerted if any changes were made.
If you’re looking for a tool combining server and application monitoring with a configuration manager, then SPCB is a great choice. It functions beautifully as an IIS server monitor, among other things. You can access a fully functional 30-day free trial of SPCB here.
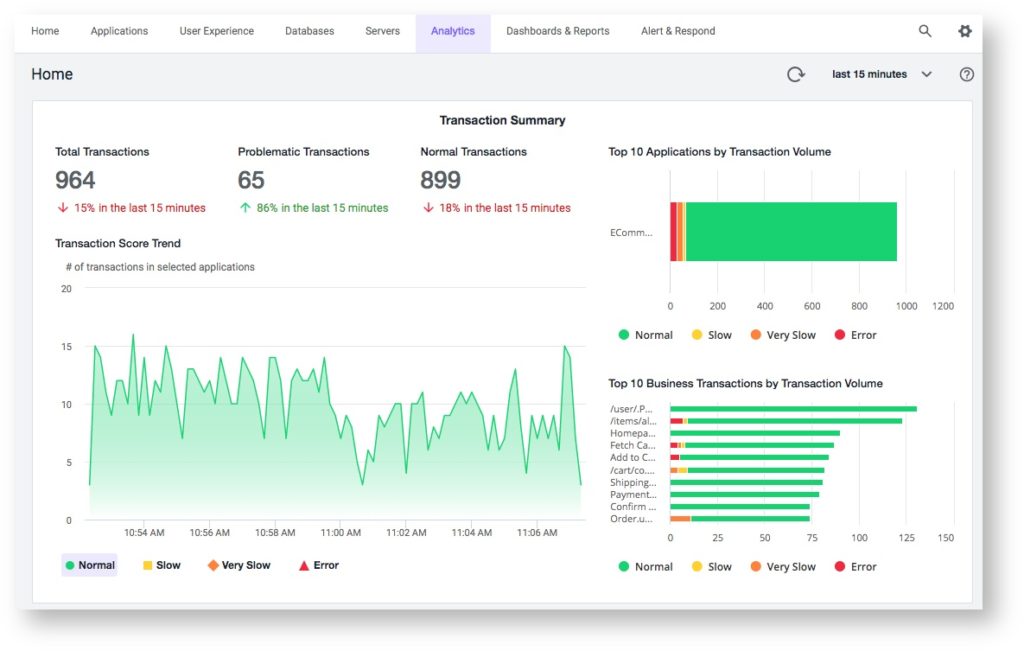
AppDynamics offers a simple tool to give you full visibility into your Microsoft IIS server performance. It claims to lower MTTR by up to 90% and can diagnose problems at the level of the code. There’s lots of reasons to like this tool. For a start, the installation process is quick, getting you up and running in just two minutes. Installation is extremely basic: download and run the installer.
With AppDynamics, you’ll be able to identify any bottlenecks hiding in your application code. If an application request is lagging, you can use what AppDynamics calls “snapshots” to analyze specific executions on an individual basis. In no more than a click, you can view the whole code execution call stack of a business transaction. You’ll be able to see the latency of each method, and the interface and class used. This gives you ultimate visibility into what’s happened within the IIS server and the code itself.
This Windows IIS tool is wonderful if you like working at the level of code. It enables you to resolve IIS deadlocks quickly and easily by collecting entire call stack traces on an automatic basis. This utility covers lagging transactions, stalls, and errors, and you’ll be able to drill down into the nitty-gritty of your production environment, reaching the method and class level.
AppDynamics is a versatile, comprehensive tool with a range of uses. It’s an effective application performance manager, offering you monitoring and management utilities covering the overall performance of complex distributed apps. It can be used for end-user monitoring, delivering a solution for tracking mobile and browser real-user activity, as well as browser synthetic monitoring. It also has real-time business monitoring features, giving you insight into wider IT operations, the nuances of the end user’s experience, and the outcomes of business activities. It tracks logs, transactions, and browsers, and offers mobile analytics.
AppDynamics supports Microsoft IIS 6.0, 7.0, 8.0, 8.5, and 10, as well as Visual Studio development server Cassini. With this tool, you’ll also be able to monitor Azure and .NET Framework 2.0 and up. There’s a 15-day free trial.
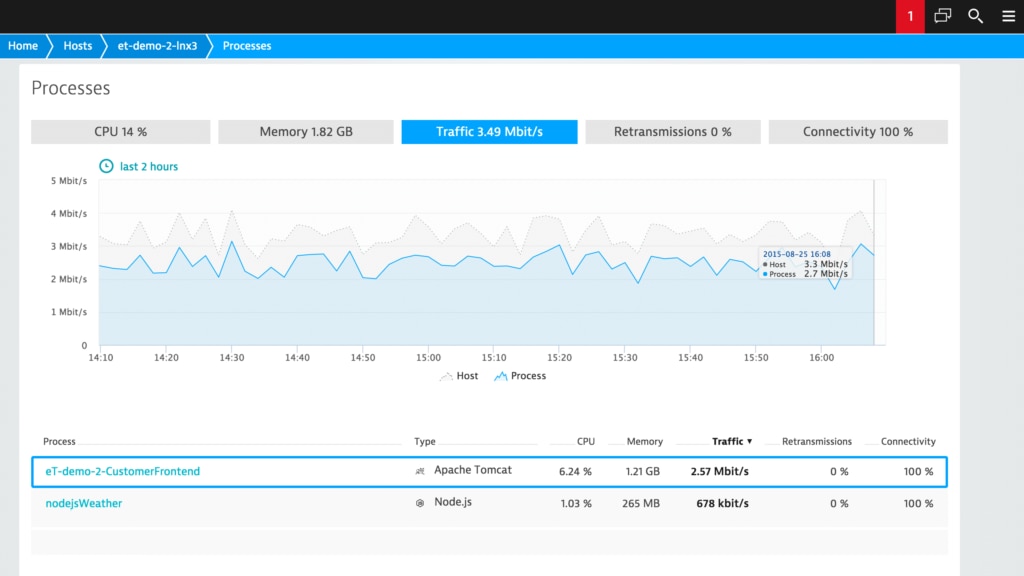
Dynatrace is another great tool for monitoring IIS server performance. It stands out from its competitors for a number of reasons, including only using a single agent. That means one agent for monitoring your entire application stack. This tool is highly automated, with auto-discovery, auto-baselining, and auto-deployment. Updates and root cause analysis are automated, too. This can wind up saving you time.
Dynatrace is something of a one-stop shop, with a wide range of functionalities. Unlike many other, traditional monitoring tools, which take an APM-centric approach, Dynatrace covers APM, cloud infrastructure, and digital experience (e.g., real user monitoring, session replay, synthetic tests) for hybrid multi-cloud environments.
This is a very scalable application. You can start small and work up to over 100,000 hosts per cluster if you like. It has been designed for microservice architectures, which boosts scalability.
The dashboard for Dynatrace is dynamic, which I really like, though it might seem like overkill to some users. It’s colorful and prioritizes graphic representations over bulk plain text, making the user experience engaging and more enjoyable than most monitoring solution dashboards. From within the dashboard, you can view web server availability and drill into web server process groups.
If you’re looking for an end-to-end online IIS server monitoring solution, Dynatrace is worth trying out. You can try it out during a free 15-day trial. The tool is ready to go in less than five minutes, meaning you can get started straightaway.
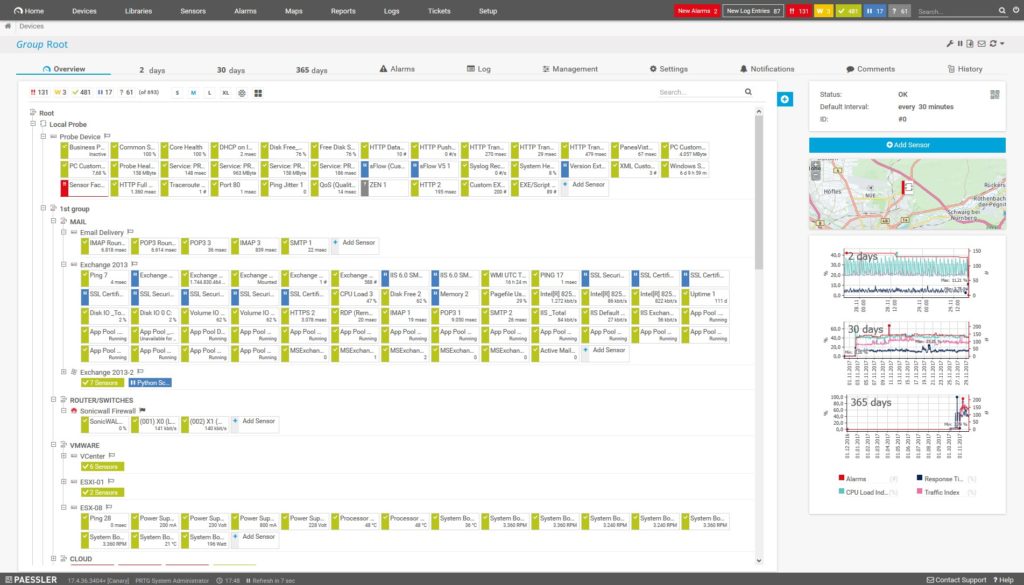
Paessler is another big name in the market, and it offers a feature-rich program called PRTG. This is a network monitor, but it does far more than that. With PRTG you can monitor all the devices, systems, traffic, and apps across your infrastructure.
This tool covers bandwidth, allowing you to analyze it and detect any overloads, with support for packet sniffing, NetFlow, WMI, and SNMP. It also monitors databases (e.g., Microsoft SQL, Oracle SQL, MySQL, PostgreSQL), helping you prevent downtime and improve performance. PRTG additionally functions as an application monitor, with the ability to monitor cloud and virtualized programs. You can stay on top of your firewalls and any strange network activity and achieve full control over how your resources are used.
My favorite feature of PRTG has to be its impressive graphing capabilities. You can even create your own custom maps, drilling into them to gain more detailed insights into your system. The major drawback, in my view, is the tool’s sensor-based approach to pricing, which could result in you paying for more than you’re using. Nonetheless, PRTG offers a competitive IIS server monitoring solution.
If you want to give PRTG a try, the first 100 sensors are free to use. You can also get a 30-day free trial of the paid version.
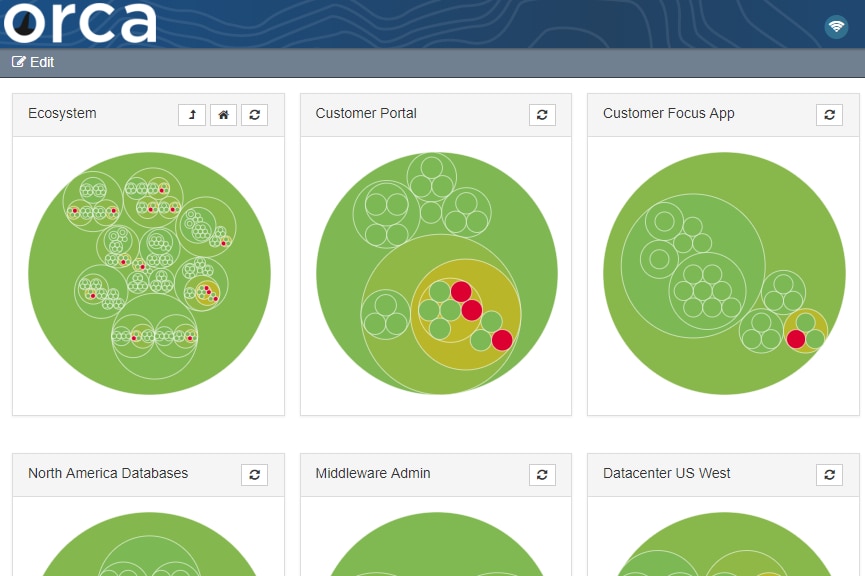
Orca is a configuration management program for IIS servers. You can use Orca to compare IIS configurations, on an automated basis, so you can identify and track any differences. Comparisons can cross environments and time periods, allowing you to define specific parameters to filter which groups of configurations are compared at any given time.
When a new configuration is ready to be deployed, you can do this in bulk, altering hundreds of servers simultaneously. Moreover, if any configuration changes are flagged as being noncompliant or unauthorized, you can get rid of these instantly.
Orca is a very effective tool. It auto-discovers application stack configs and can rapidly identify unexpected or unusual differences within the environment, and configuration drift and compliance breaches. I particularly like how differences are represented in the Orca console, which displays configs in the form of maps. These maps give you a view of pre-production and production ecosystems within one unified dashboard.
While this is a useful application, it focuses on configuration management and doesn’t offer the same scope and range of functionalities as some other tools on this list. A 30-day free trial is available.
If you’re looking for a dependable and comprehensive tool for your IIS server, you can’t do better than SolarWinds SAM. This program has a great dashboard, is user-friendly, and offers extensive functionality coupled with sophisticated, high-quality features. It combines all the things I look for in a tool, including intuitive design and a dynamic interface, and offers a fully functional free trial or a free demo.